
Where Expensive Homes Do Not Mean Expensive Property Tax Bills
A look at large high-value city rollups where median property tax bills stay unusually low.
A high home value usually raises a simple expectation: the tax bill should be high too. The city-level property tax data does not always follow that script.
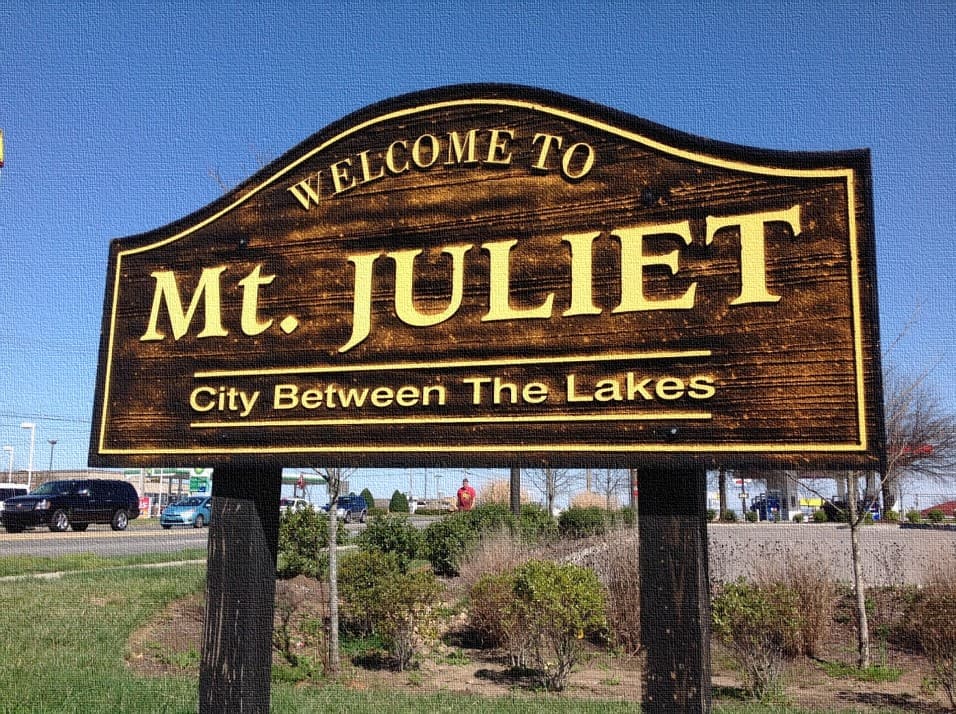
In AssessorSearch's city rollups, 248 cities have at least 20,000 usable tax records and a median estimated home value above $500,000. The median annual property tax bill inside that group is $5,794. Mount Juliet, TN sits far below that mark: a median estimated value of $549,741 and a median annual tax bill of $1,717.
The surprising list is not a cheapest-cities list
This is not a ranking of low-cost places. Every city below clears the same value threshold. Some are established suburbs, some are fast-growing Mountain West cities, and some are high-amenity retirement or tourism markets. What they share is the gap between housing value and the recurring property tax bill.
Only 16 cities in the cohort have median bills at or below $2,500. Only 26 are at or below $3,000. That makes the top of the list a narrow group, not a broad national pattern.
| Rank | City | County | Median value | Median bill | Rate | Records |
|---|---|---|---|---|---|---|
| 1 | Mount Juliet, TN | Wilson County | $549,741 | $1,717 | 0.31% | 23,148 |
| 2 | Hendersonville, TN | Sumner County | $502,948 | $1,753 | 0.35% | 24,026 |
| 3 | Meridian, ID | Ada County | $535,268 | $1,762 | 0.32% | 46,884 |
| 4 | Prescott, AZ | Yavapai County | $622,760 | $1,806 | 0.29% | 28,195 |
| 5 | Saint George, UT | Washington County | $507,373 | $1,907 | 0.36% | 37,720 |
| 6 | Chandler, AZ | Maricopa County | $524,531 | $2,030 | 0.38% | 86,040 |
| 7 | Reno, NV | Washoe County | $579,416 | $2,036 | 0.34% | 78,359 |
| 8 | Orem, UT | Utah County | $561,088 | $2,036 | 0.37% | 22,367 |
| 9 | Sparks, NV | Washoe County | $531,271 | $2,045 | 0.37% | 36,893 |
| 10 | Gilbert, AZ | Maricopa County | $573,500 | $2,129 | 0.36% | 87,029 |
| 11 | Charleston, SC | Charleston County | $561,257 | $2,231 | 0.37% | 53,480 |
| 12 | Coeur D Alene, ID | Kootenai County | $595,772 | $2,238 | 0.36% | 21,697 |
| 13 | Lehi, UT | Utah County | $622,580 | $2,389 | 0.39% | 24,168 |
| 14 | Loveland, CO | Larimer County | $508,902 | $2,417 | 0.47% | 32,154 |
| 15 | Provo, UT | Utah County | $530,218 | $2,448 | 0.47% | 22,642 |
| 16 | Bluffton, SC | Beaufort County | $511,249 | $2,474 | 0.44% | 25,708 |
| 17 | Honolulu, HI | Honolulu County | $803,449 | $2,510 | 0.33% | 124,227 |
| 18 | Flagstaff, AZ | Coconino County | $681,475 | $2,511 | 0.37% | 20,596 |
| 19 | Layton, UT | Davis County | $539,802 | $2,516 | 0.47% | 20,035 |
| 20 | Mount Pleasant, SC | Charleston County | $892,202 | $2,524 | 0.26% | 35,333 |
The geography has a pattern
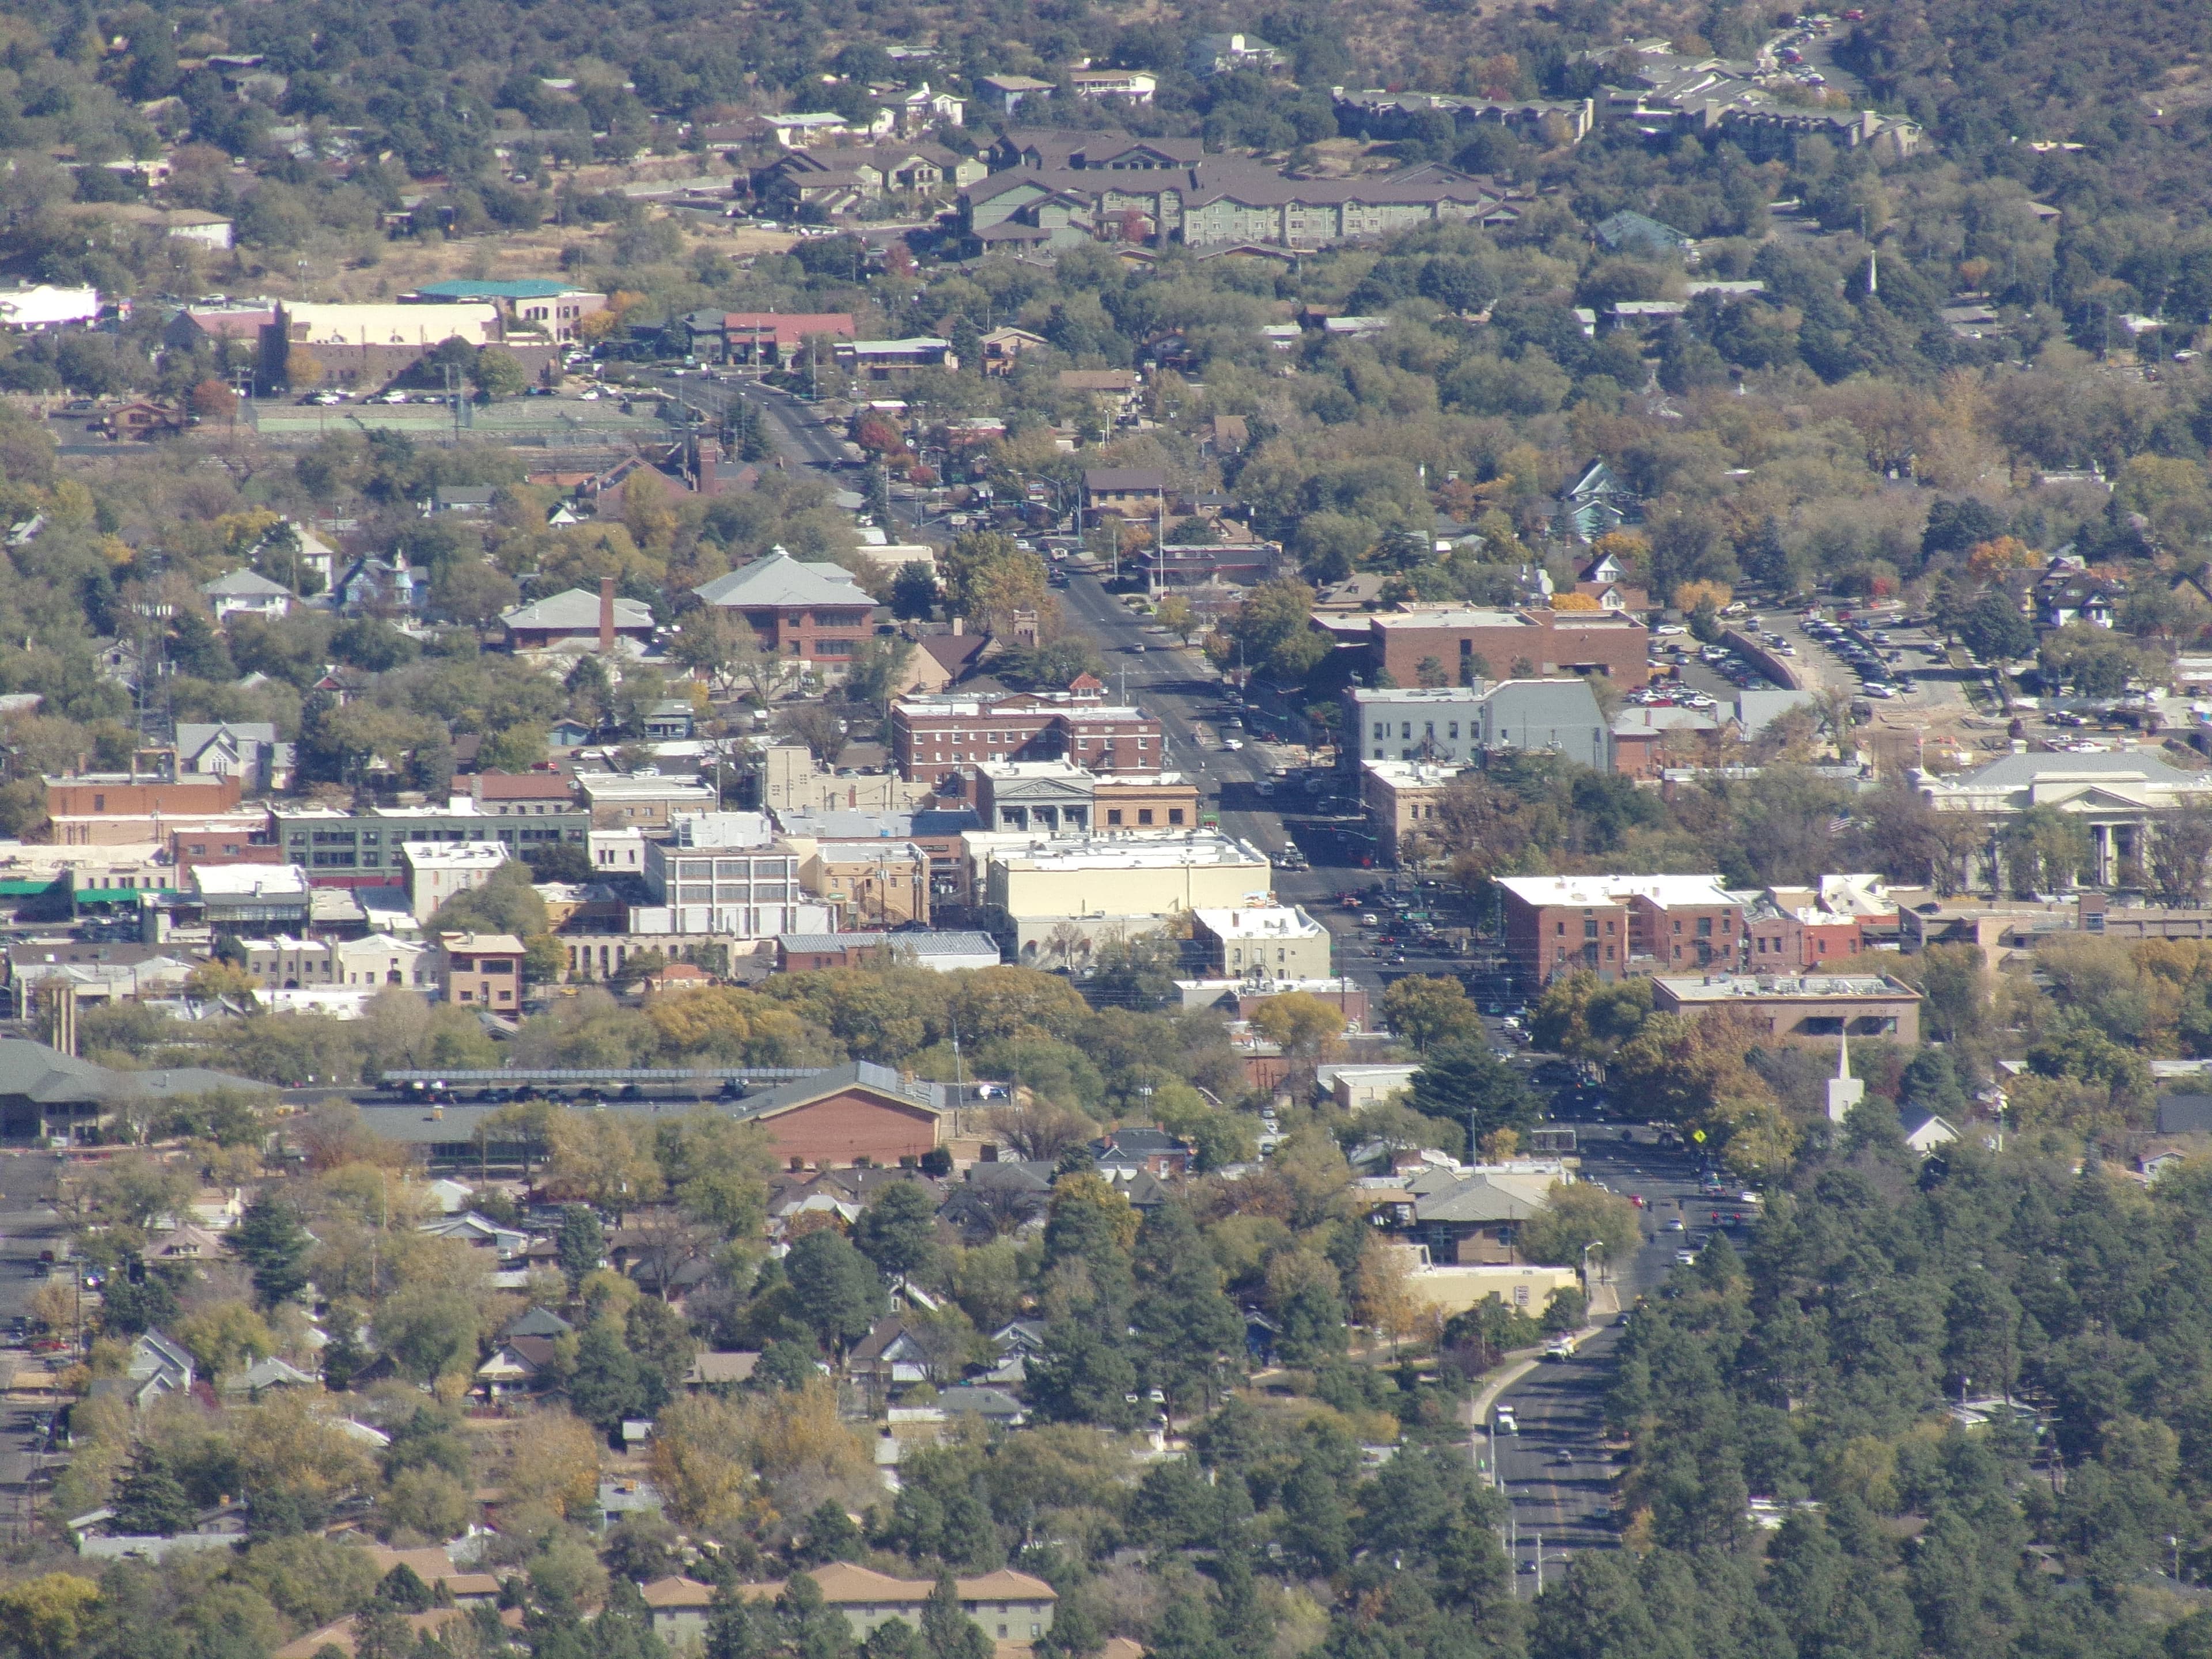
The low-bill side of the high-value cohort clusters in the Mountain West and parts of the South. Utah and Colorado are the most common states in the top 50, with Arizona, South Carolina, California, Tennessee, Idaho, and Virginia also appearing multiple times. That does not make any one state a simple winner, but it does show that the story is not random.

The other side is useful, but it is not the main story
The opposite examples are easy to find. In the same high-value cohort, 16 cities have median annual property tax bills of at least $10,000. The top end includes New York, NY ($18,929); Sammamish, WA ($13,892); Danville, CA ($13,273); Dublin, CA ($12,624); San Ramon, CA ($12,575). Those places are important context, but a table of the highest bills mostly repeats what readers already expect from expensive coastal and northeastern markets.
The more revealing finding is the mismatch. Some city rollups combine median values above $500,000 with tax bills that look more like lower-cost markets. That gap is the story worth following.
What this does and does not say
This is a property tax bill story, not a total tax burden story. It does not include income tax, sales tax, insurance, homeowner association dues, local service levels, or special assessments. It also uses property-record city names and rollups, which may not match official municipal boundaries in every case.
The value of the cut is narrower and more practical: if a reader is comparing high-value housing markets, the recurring property tax bill can vary by thousands of dollars a year even before the rest of the tax picture is considered.
Methodology
AssessorSearch filtered the city CSV to places with at least 20,000 usable tax records and a median estimated property value of at least $500,000. Cities were ranked by median annual tax amount, from lowest to highest. Effective property tax rate is annual property tax amount divided by estimated market value. The full release contains 808 city rollups above the record threshold and 24,360 total city rows. One Fulton County, Georgia city rollup was excluded after ACS validation suggested the tax amount field was missing local tax components. Source data is dated 2026-06-10.